Does LumiPoints change anything in my Etsy or Printify shop?
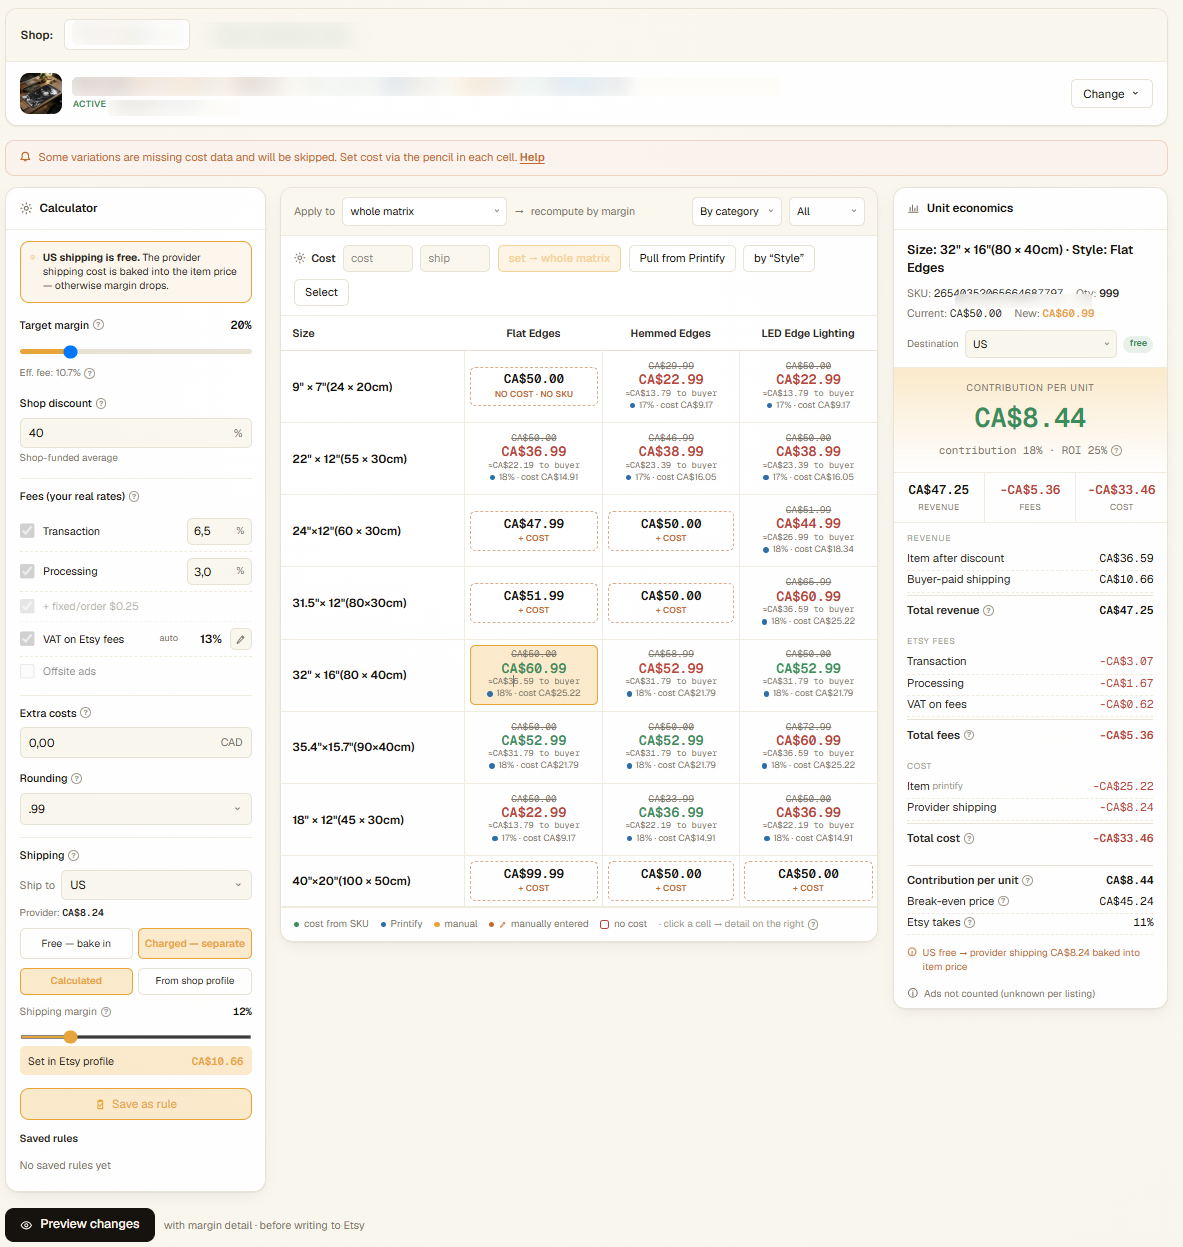
No. Sync is read-only first — LumiPoints reads orders, fees, and costs to build your P&L. Nothing is written back to Etsy until you explicitly review and approve a pricing change.
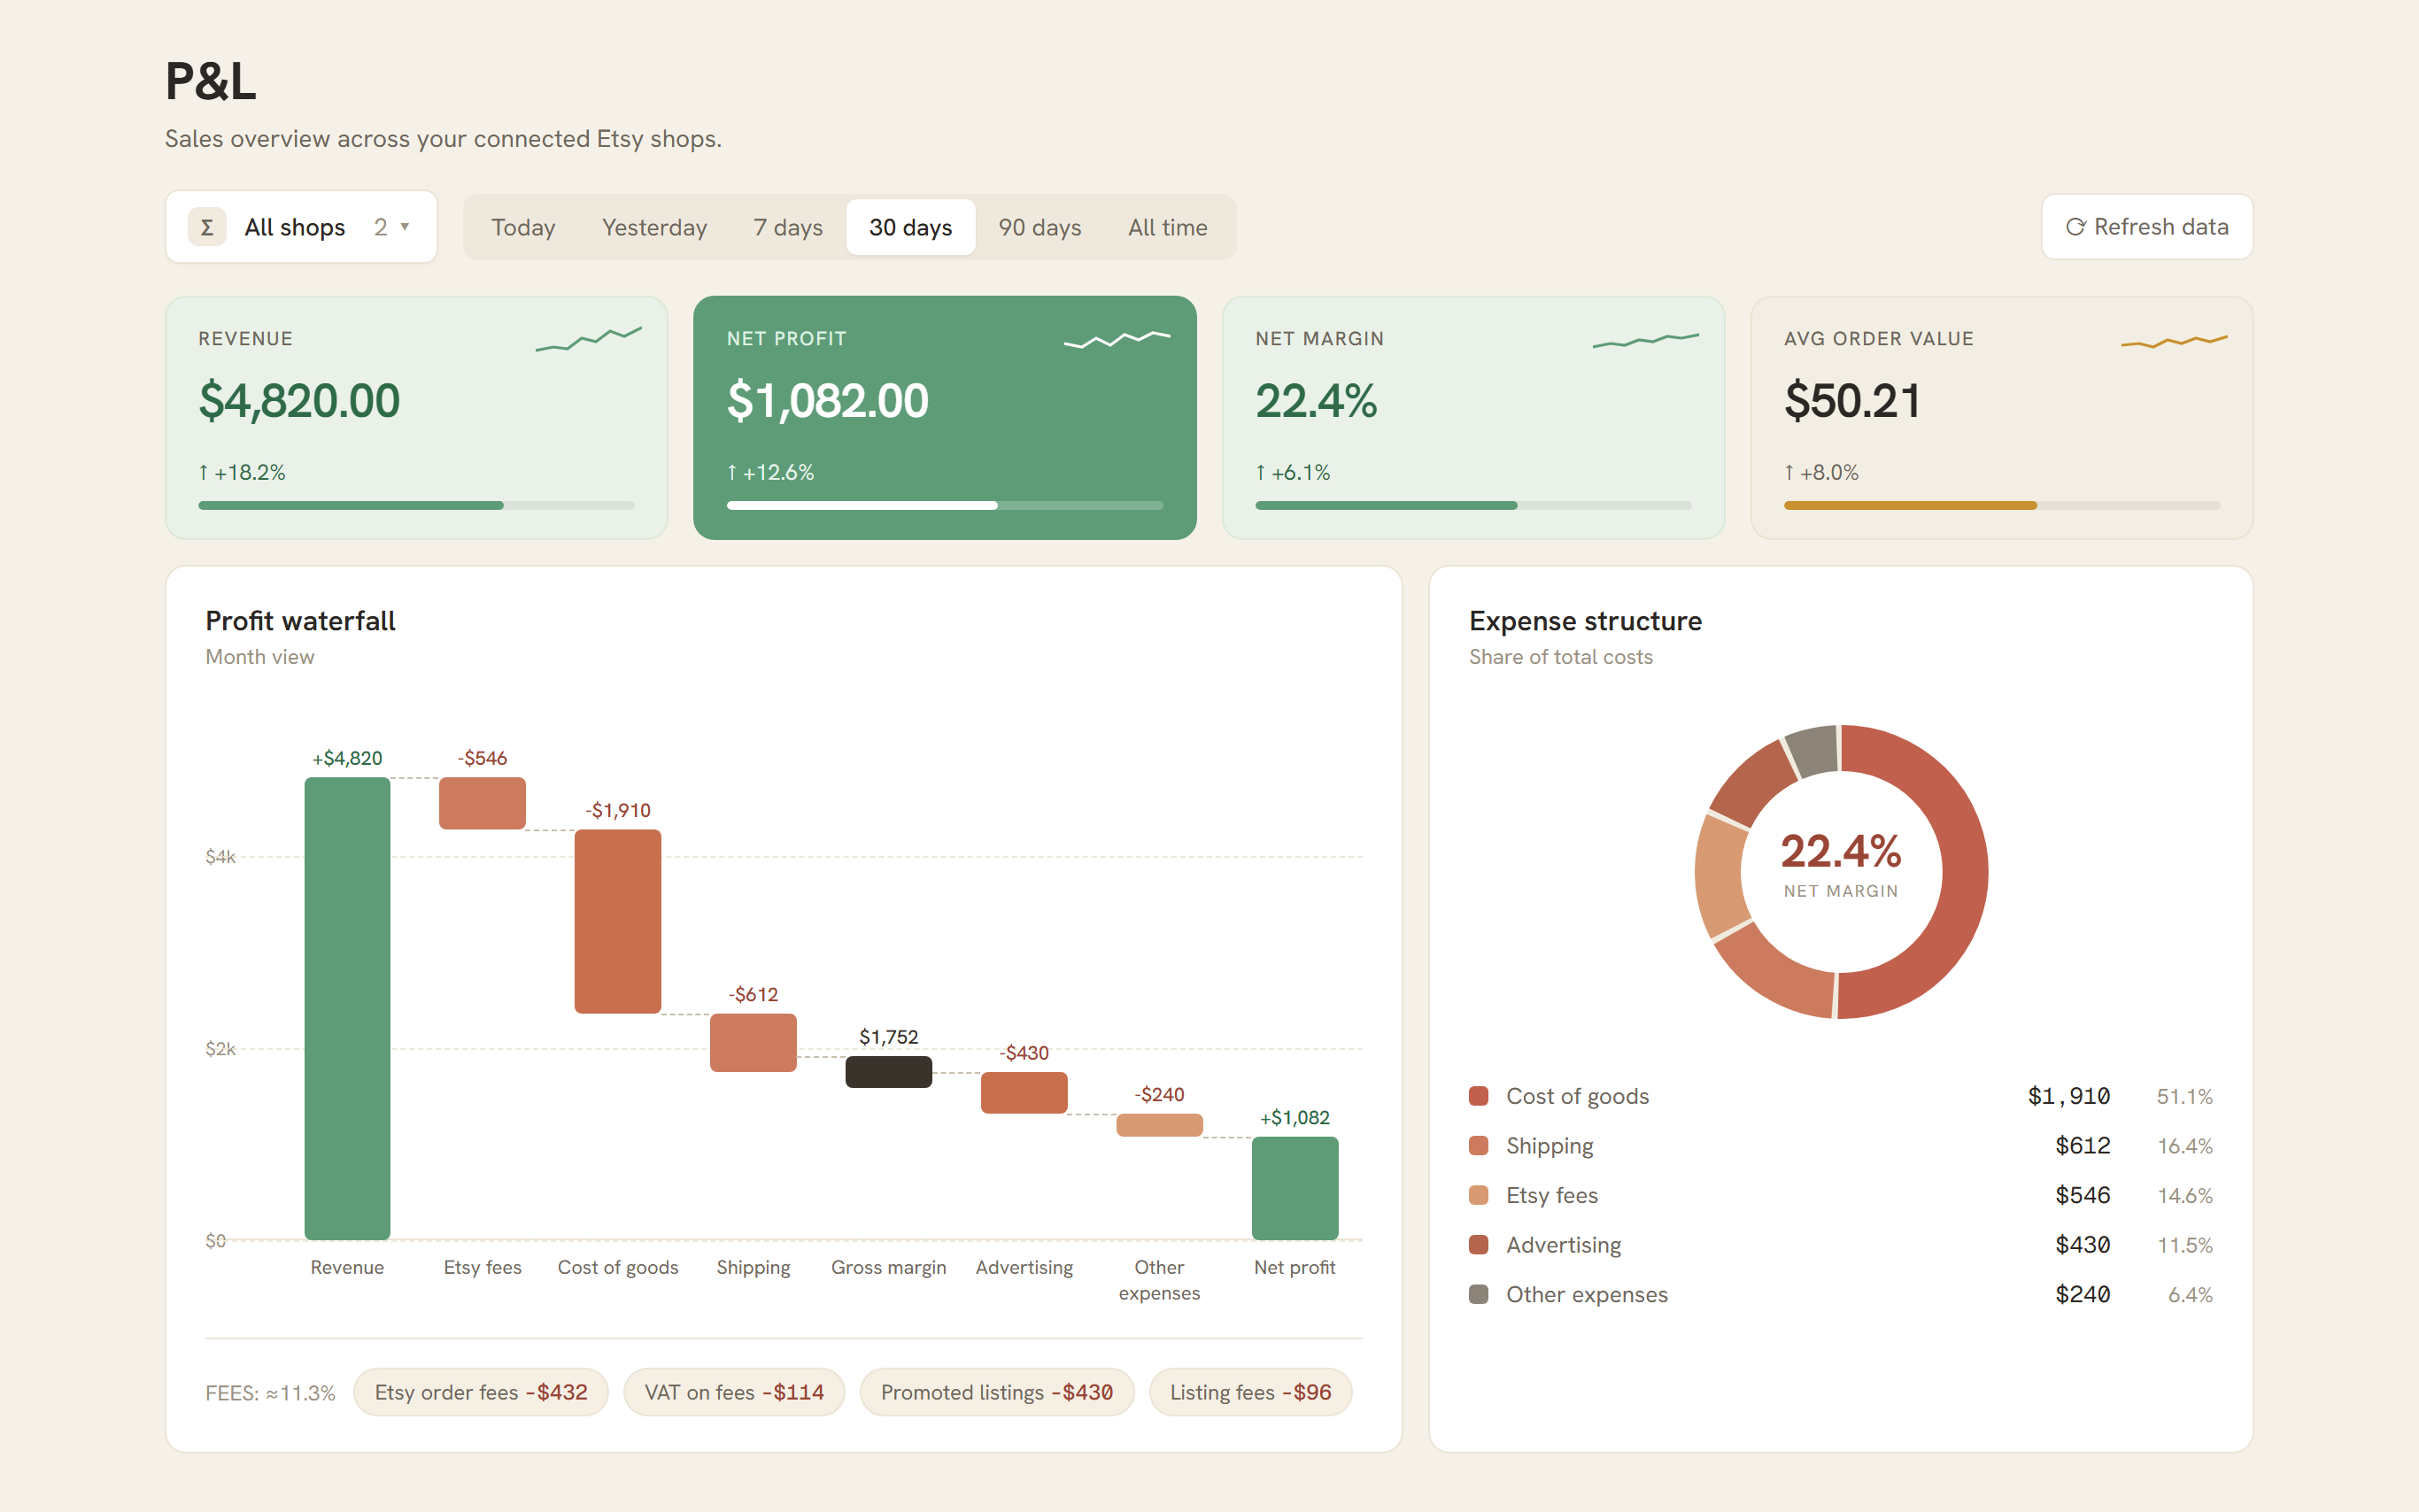
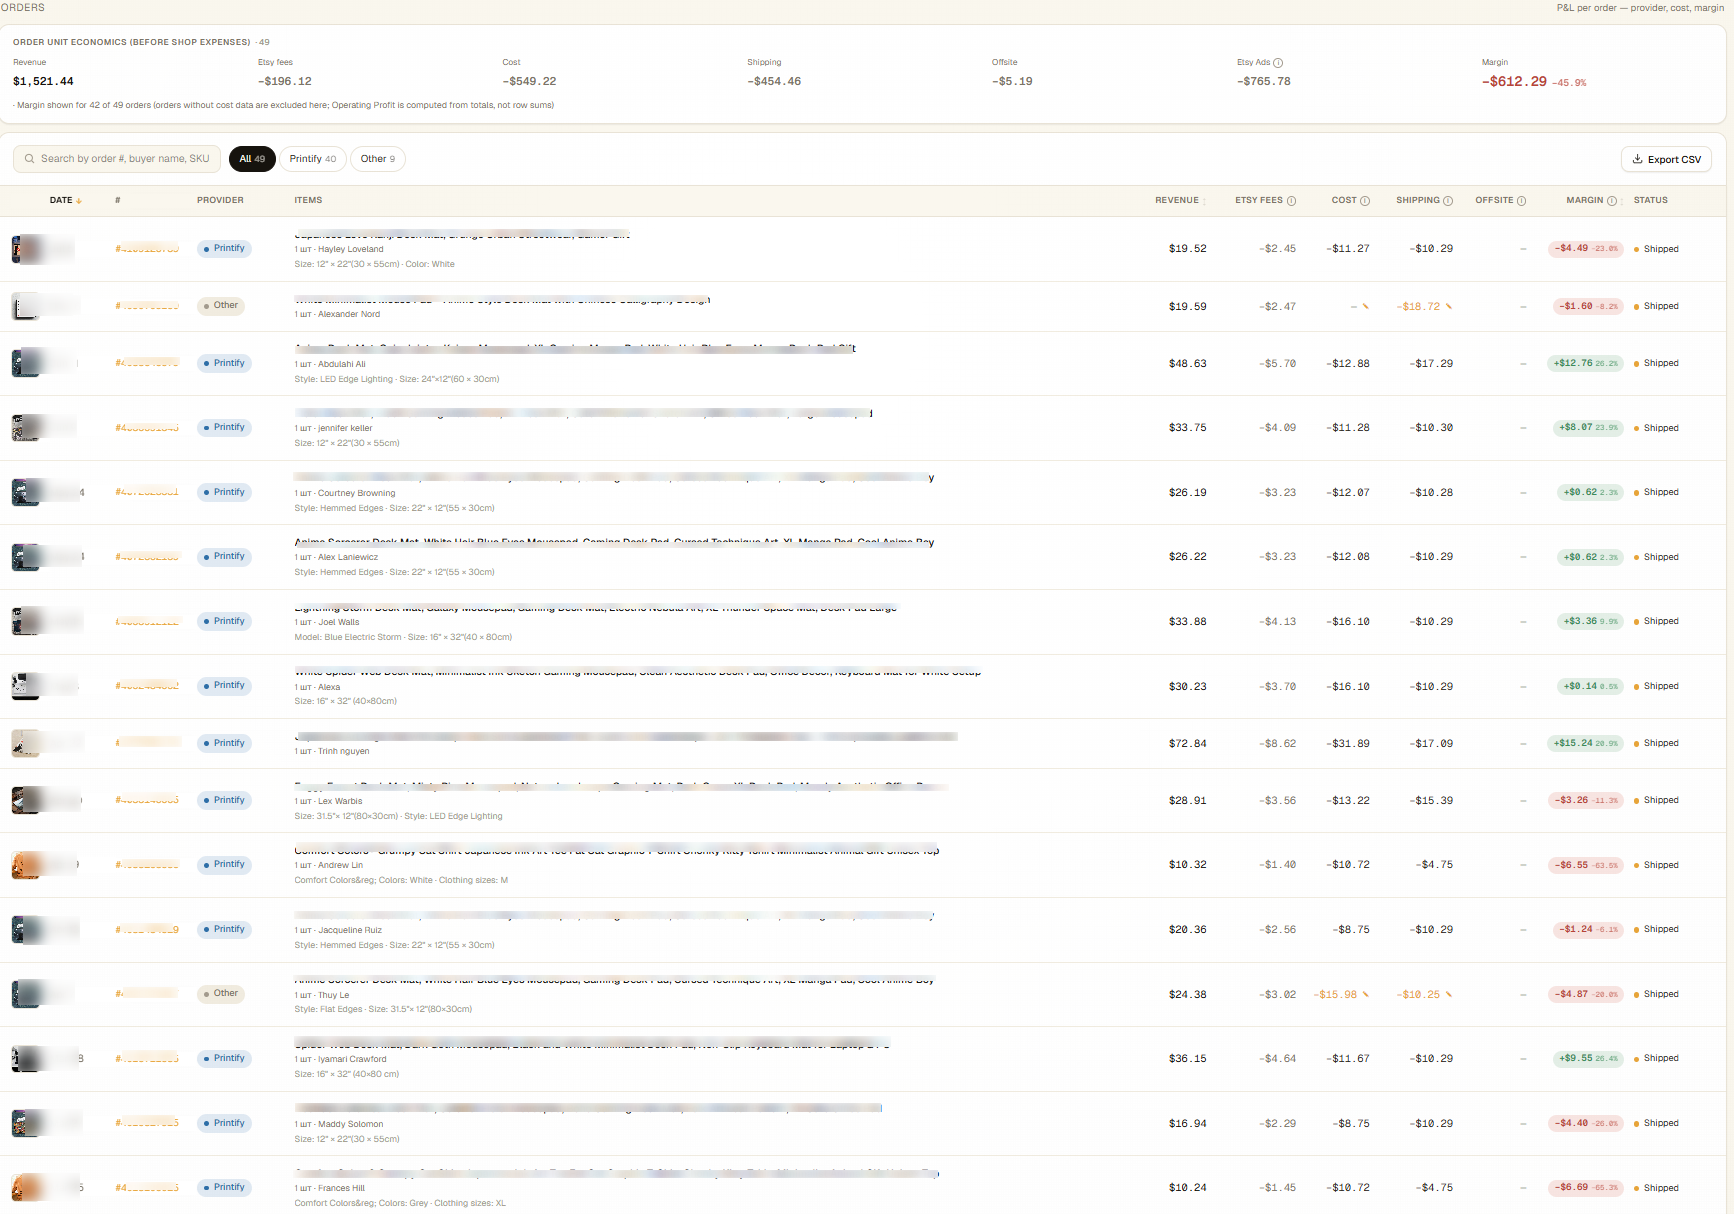
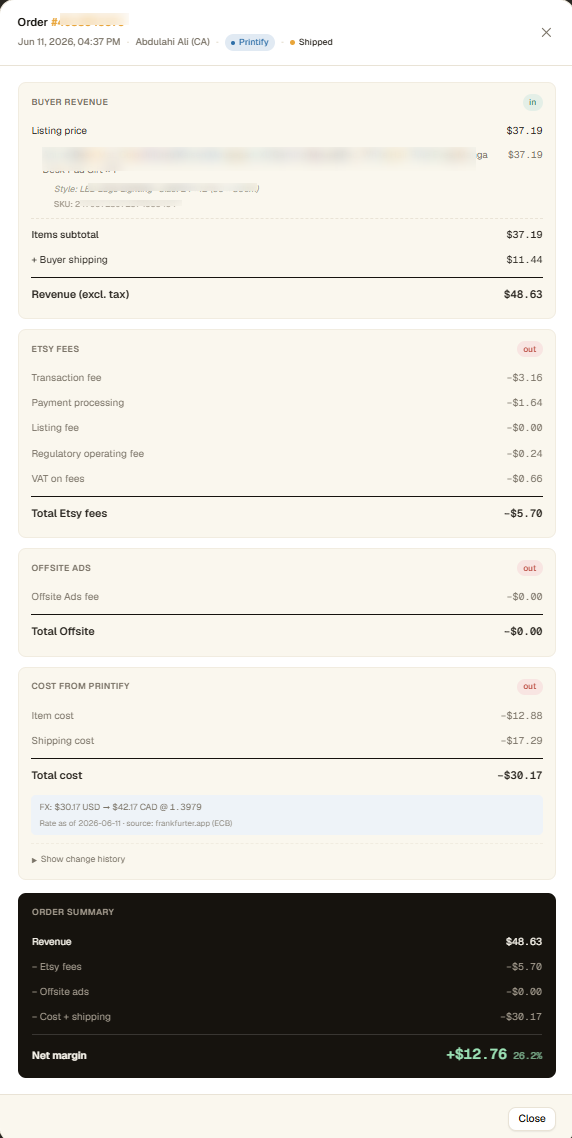
Where do the cost numbers come from?
Printify item and shipping costs are matched to each order by SKU, and Etsy transaction, processing, and ad fees — including offsite ads — come straight from your order ledger, not estimates. Every figure is traceable back to the fee or cost behind it.
Is there AI inside LumiPoints?
No. LumiPoints has no built-in AI and does not analyze your data with AI. If you want, you can connect your own AI assistant — Claude, ChatGPT, Gemini, Cursor, or any MCP-compatible agent — to read your numbers. It runs on your side, read-only, and your data is never used to train anything.
What can I do with my own AI agent (MCP)?
LumiPoints connects to your own AI assistant over MCP — an open standard — so the tool you already use (Claude, ChatGPT, Gemini, Cursor, or any MCP-compatible app) can read your LumiPoints data. Then you just ask in plain language: “Which listings lost money last month?”, “What's my real profit after offsite ads?”, “Which products are worth scaling?” — and it answers from your actual numbers instead of a guess. It stays read-only: your agent can look and explain, never change your shop, and your data is never used to train any model.
Do you handle EU VAT charged on Etsy fees?
Yes. If Etsy charges VAT on top of its fees for your shop, LumiPoints reads it from your ledger and includes it in your per-order profit — one of the costs sellers most often miss.
Is my shop data safe? How is it deleted?
Connections are read-only by default and you can disconnect at any time. LumiPoints only reads what it needs to build your operating P&L. When you delete your account or disconnect a shop, we remove your data — Printify-sourced data is deleted within 30 days, per Printify's rules — and you can ask us to delete your data at any time.
Do I have to rebuild my spreadsheets?
No. Connect Etsy and Printify and the operating P&L assembles itself. Export to CSV, Excel, or PDF whenever you need the numbers elsewhere.
What does the free trial include? Can I cancel anytime?
Full access to Growth for 14 days, no card required — see your real numbers before deciding anything. Your 14 days start when you connect your first shop, not at sign-up. After the trial there's a free-forever plan with real per-order profit. You can cancel a paid plan in one click, anytime — no emails to support. Billing is handled by Paddle, our Merchant of Record.
Is this financial advice?
No. LumiPoints shows you the numbers from your own shop and helps you read them. It is not financial, tax, or accounting advice. For decisions about taxes or your business, talk to a qualified professional.